Portfolio & data visualization · 2025
Asset One
Every asset. One clear view.
Asset One brings holdings and market data into a mobile interface. I built the React views for portfolio charts, asset selection, transaction history and currency conversion.
The chart connects time ranges, price series and portfolio snapshots. Selecting an asset or inspecting a point in time changes what the interface presents, while shared state keeps the underlying data consistent.
Make a dense dataset feel approachable
The chart component renders portfolio snapshots and individual asset prices through the same interaction model. Range selection changes the series; dragging across the chart reveals values at a particular point in time.
The preview uses the application’s InstrumentChart, asset picker and balance display, backed by deterministic sample data. It needs no wallet connection and does not request current market prices.
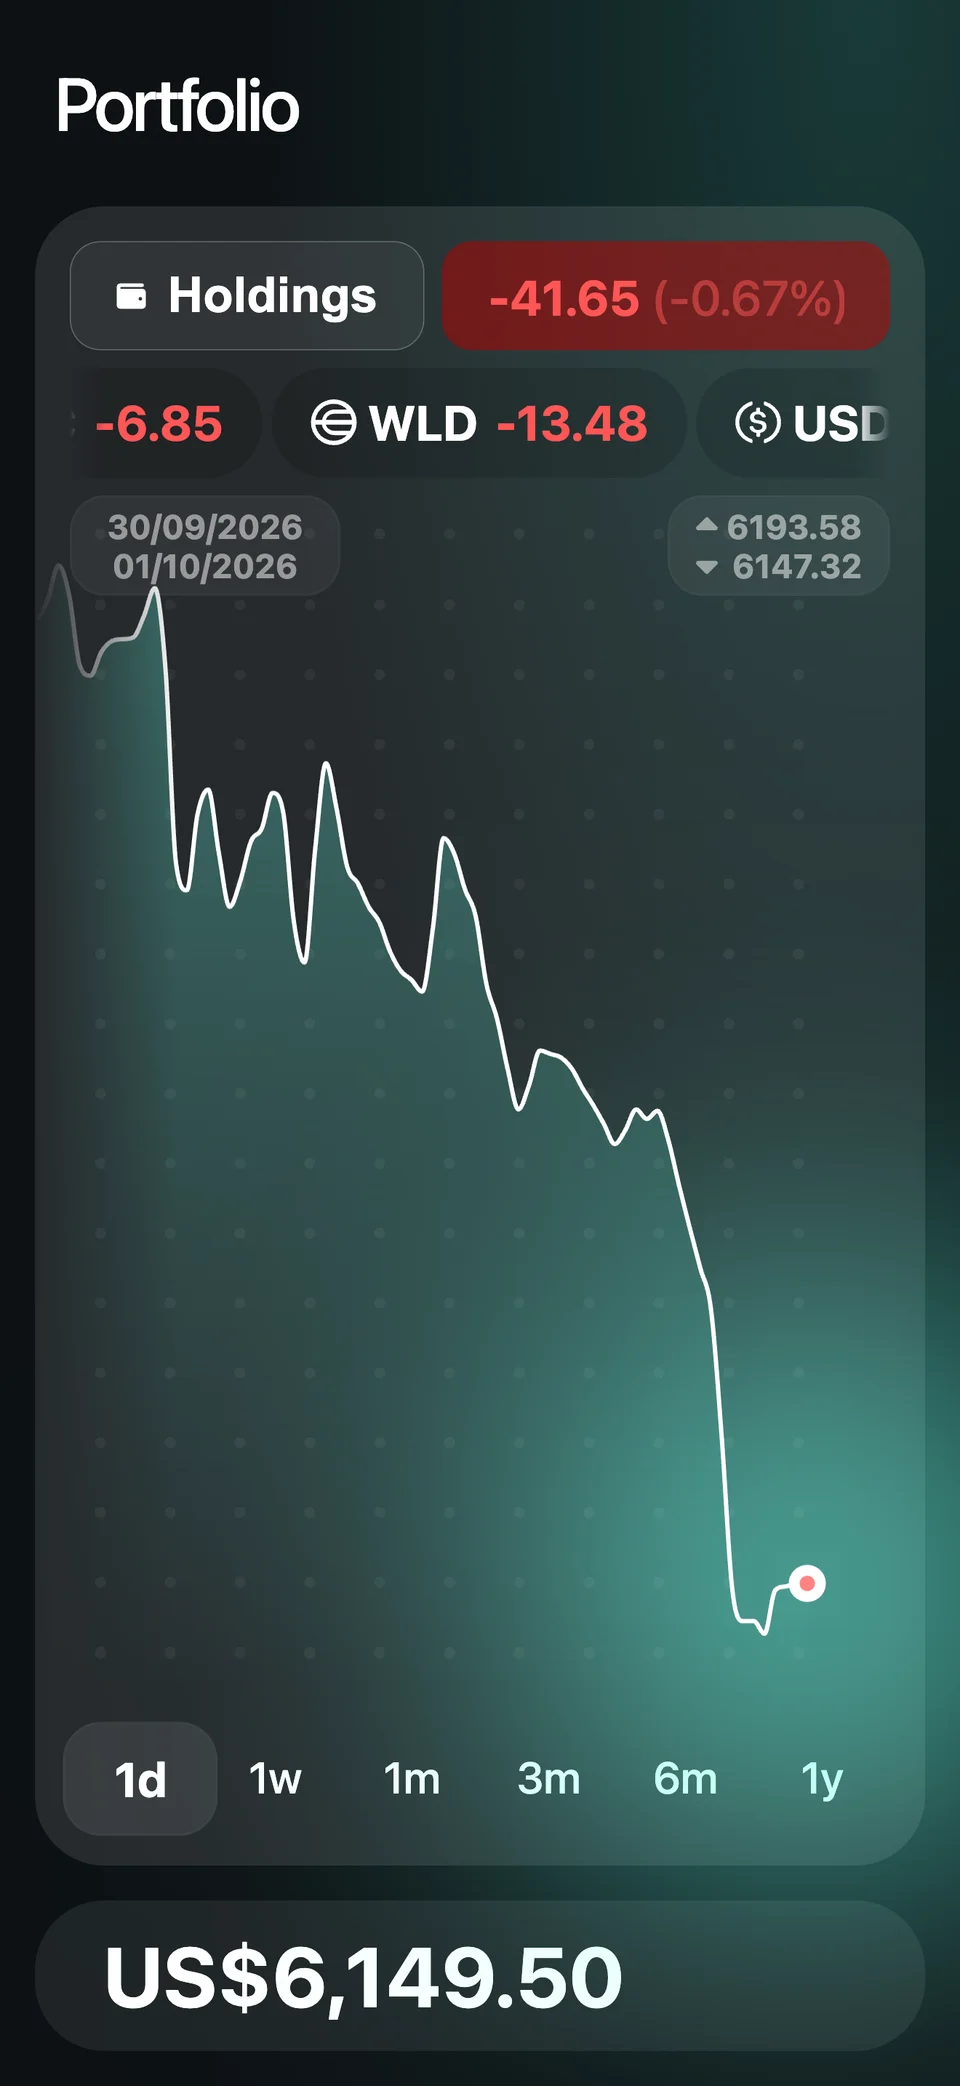
Asset One. Explore time ranges, choose an asset and drag across its chart. Balances and prices are fictional samples; no wallet connection is required.
Keep data separate from presentation
Typed slices describe portfolio snapshots, price histories and currency preferences. The chart consumes those slices rather than owning data fetching, which also makes it possible to run the interface in isolation.
Alongside the chart, the application includes transaction views and conversion tools. This demo focuses on the chart and selection interactions.